Bioreactor Simulation Guide
Bioreactor Types
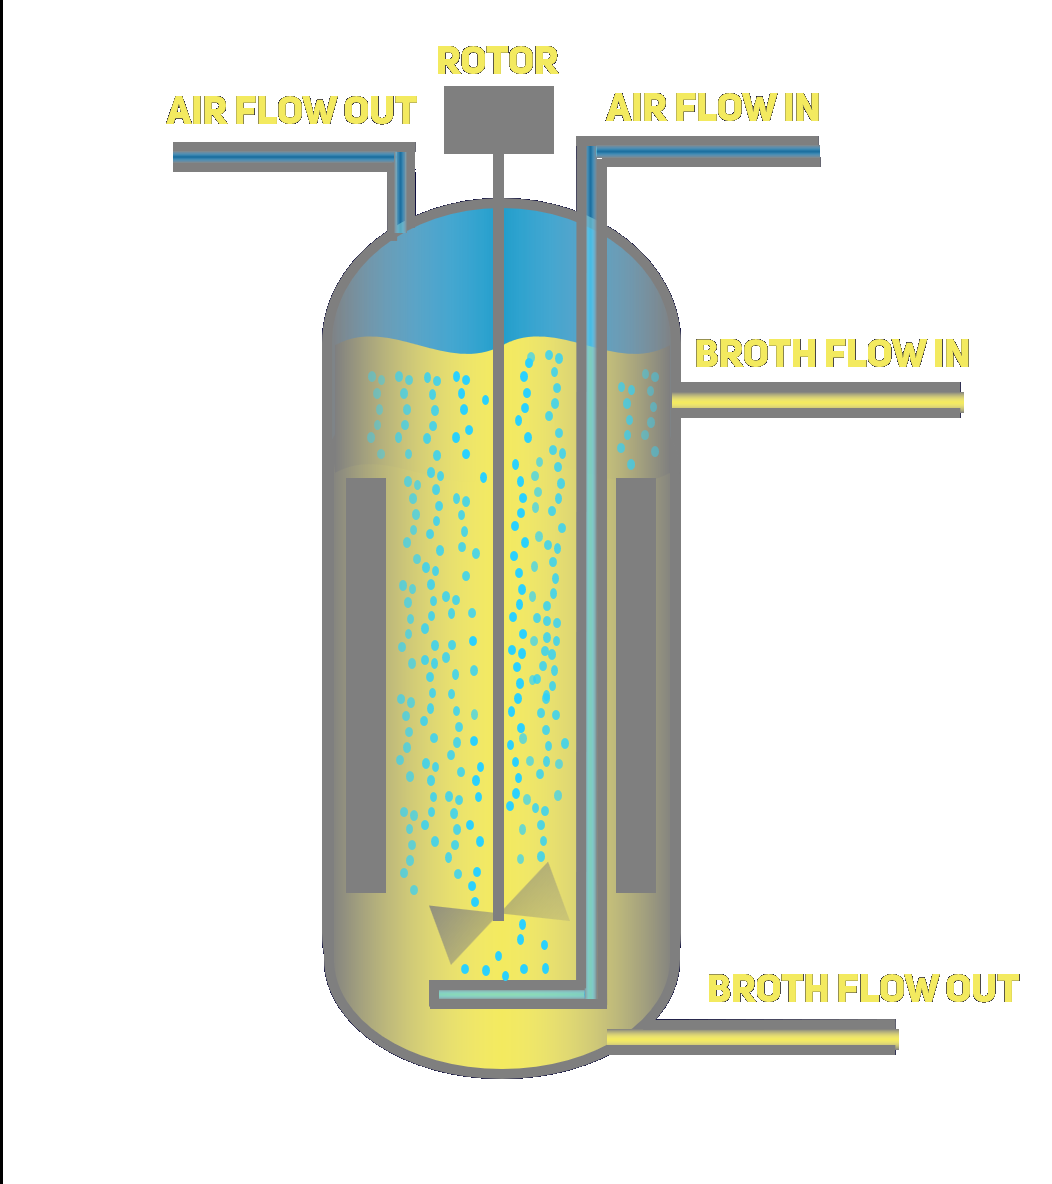
1. CSTR (Continuous Stirred Tank Reactor)
A CSTR is characterized by:
- Mechanical agitation using impellers
- Uniform mixing throughout the vessel
- Constant temperature and concentration at any point
- Typical kLa range: 100-400 h⁻¹ (in model set to 200)
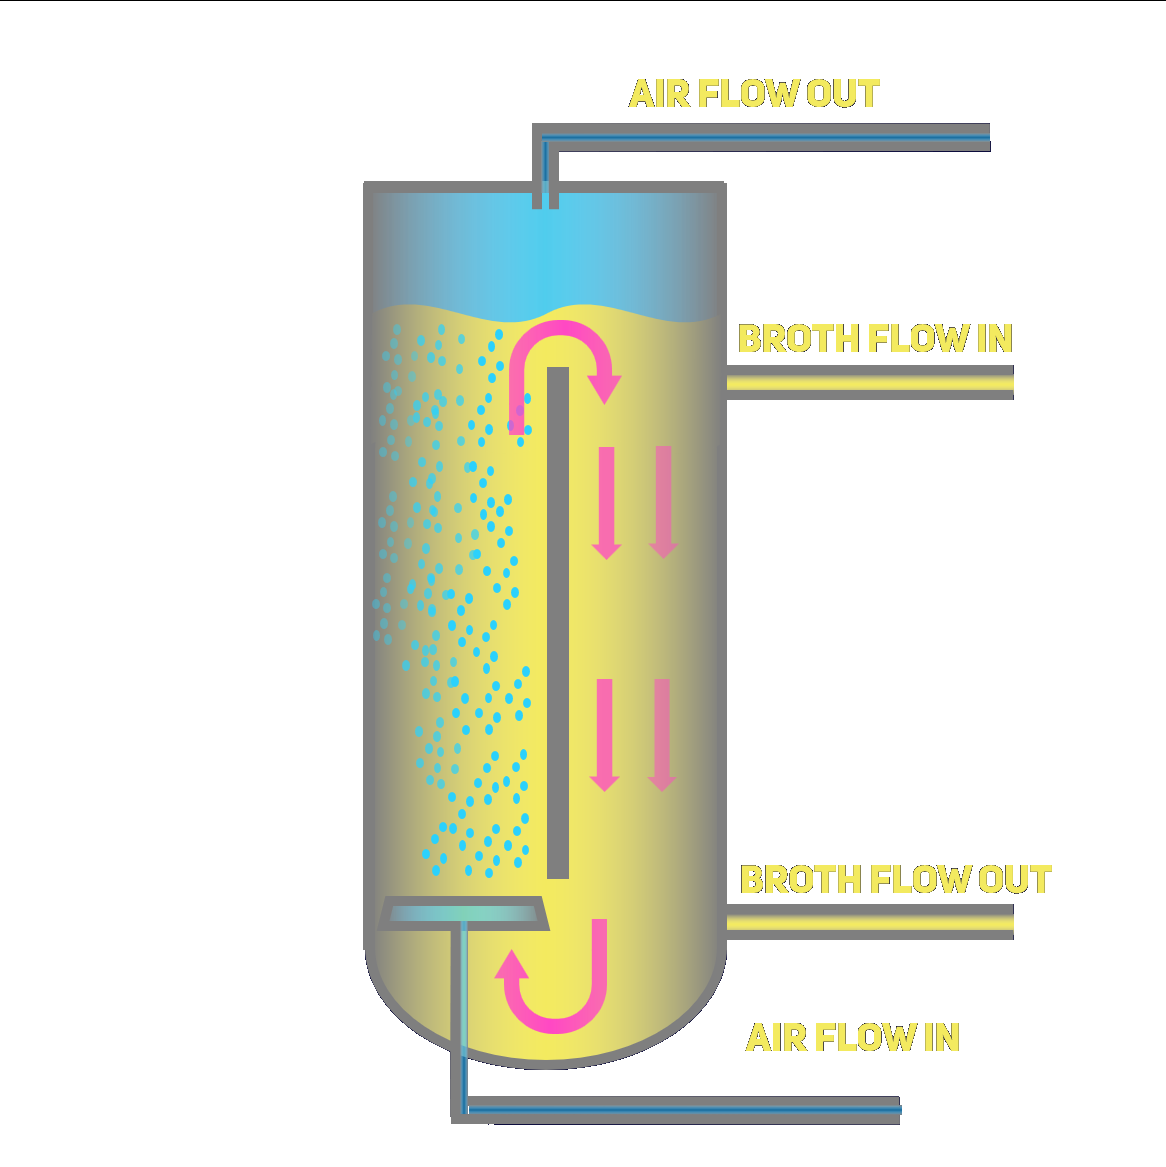
2. Airlift Reactor
Airlift reactors feature:
- No mechanical agitation
- Circulation driven by density differences
- Lower shear stress compared to CSTR
- Better for shear-sensitive organisms
- Typical kLa range: 20-100 h⁻¹ (in model set to 50)
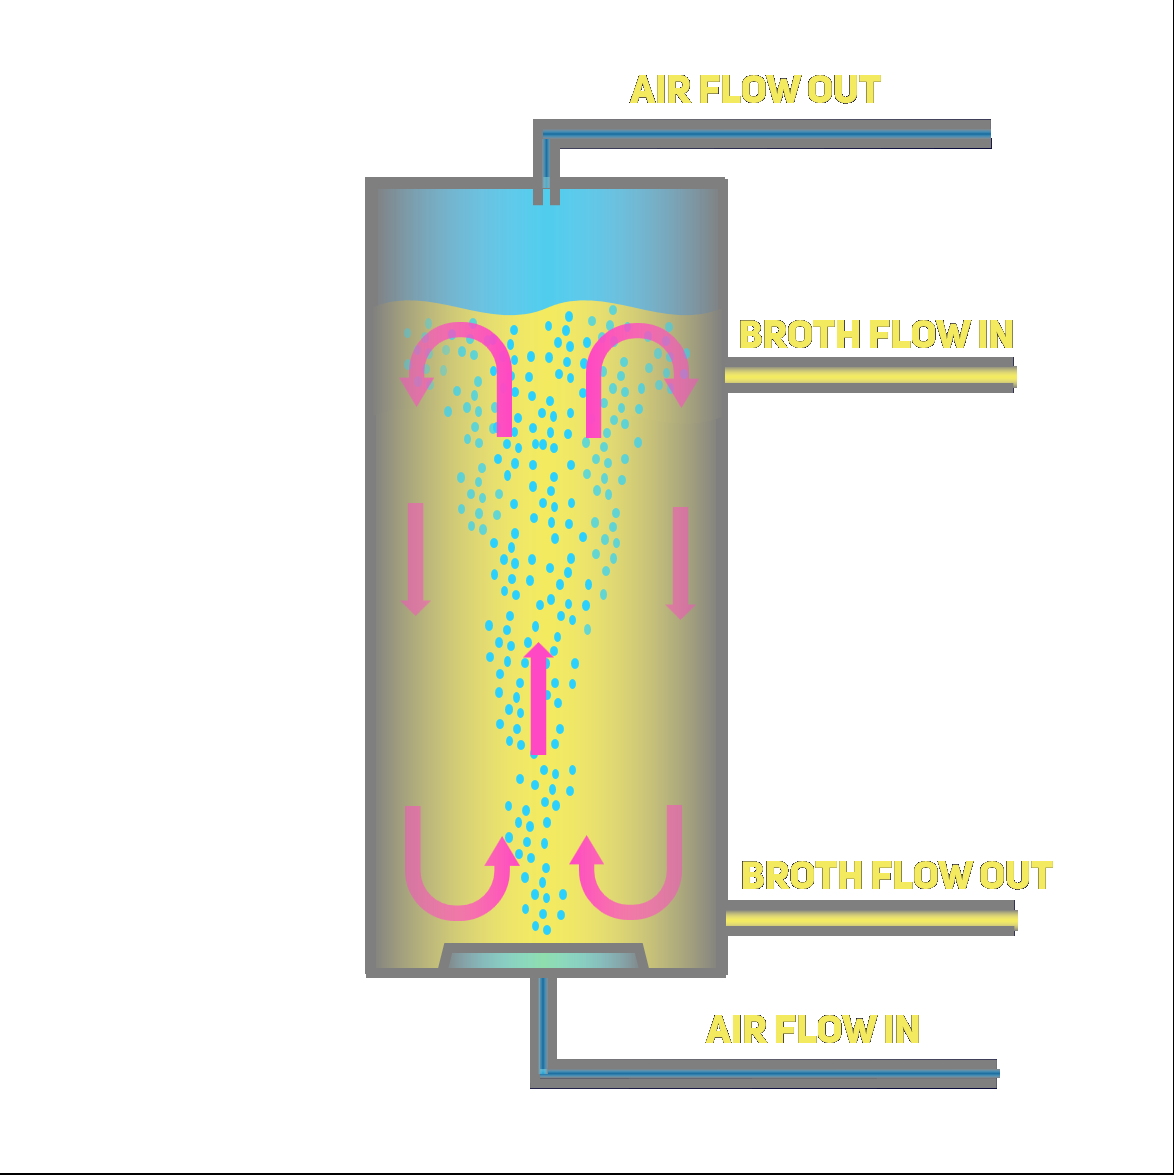
3. Bubble Column
Bubble column reactors are characterized by:
- Simple vertical column design
- Gas sparging from bottom
- No internal structures
- Cost-effective but less mixing control
- Typical kLa range: 10-60 h⁻¹ (in model set to 25)
Microorganisms
S. cerevisiae (Baker's yeast)
A eukaryotic microorganism widely used in baking and brewing. Excellent model organism for cellular processes.
Learn more →
E. coli
Gram-negative bacteria commonly used in biotechnology for protein production and molecular biology research.
Learn more →
A. niger
Filamentous fungus used industrially for citric acid production and enzyme manufacturing.
Learn more →
B. subtilis
Gram-positive bacteria known for enzyme production and as a model organism for bacterial studies.
Learn more →
Chlorella spp.
Green algae with high protein content, used in food supplements and biofuel production.
Learn more →
Lactobacillus spp.
Beneficial bacteria used in dairy fermentation and probiotic products.
Learn more →
Chicken Myogenic Stem Cells
Muscle-forming stem cells used in cultivated meat production for sustainable protein.
Learn more →
P. pastoris
Methylotrophic yeast popular for recombinant protein production in biotechnology.
Learn more →
Operation Modes
Batch Fermentation
In batch mode:
- All substrate added at the beginning
- No addition/removal during fermentation
- Substrate concentration decreases over time
- Growth follows typical phases: lag, exponential, stationary
Fed-Batch Fermentation
In fed-batch mode:
- Substrate fed continuously or intermittently
- Volume increases over time
- Better control of growth rate
- Higher final cell densities possible
- Reduced substrate inhibition
Key Calculations and Parameters
Oxygen Transfer Rate (OTR)
This measures how quickly oxygen moves from air bubbles into the liquid where cells can use it.
Think of it like dissolving sugar in water - the more you stir and the bigger the difference between how much sugar is already dissolved and how much can be dissolved, the faster it happens!
OTR = kLa × (C* - CL)
Where:
- kLa: How good the bioreactor is at moving oxygen into liquid (like how fast stirring dissolves sugar)
- C*: Maximum amount of oxygen that can dissolve in the liquid
- CL: Amount of oxygen currently dissolved in the liquid
Oxygen Uptake Rate (OUR)
This shows how quickly the cells are using up oxygen - just like how we need to breathe oxygen to live, cells need it too!
OUR = qO₂ × X
Where:
- qO₂: How much oxygen each cell uses (like how much air each person breathes)
- X: How many cells there are in the liquid (like how many people are in a room)
Growth Rate
This tells us how quickly the cells are multiplying. Cells grow faster when they have enough food (substrate) and oxygen - just like how plants grow better with the right amount of water and sunlight!
μ = μmax × (S/(Ks + S)) × (O₂/(Ko + O₂))
Where:
- μmax: The fastest possible growth rate (when conditions are perfect)
- S: How much food (substrate) is available
- Ks: How much food cells need to grow at half their maximum rate
- Ko: How much oxygen cells need to grow at half their maximum rate
Real-world example: Think about eating at a buffet. When there's lots of food (high S), you can eat at your maximum rate. But as the food runs low, you have to spend more time looking for food, so you eat slower. The same happens with cells - they grow slower when food or oxygen is limited!
Process Steps
1. Filling (Variable Duration)
Initial filling of the bioreactor with medium. Duration depends on volume and pump rate.
2. SIP - Sterilization In Place (1 hour)
Steam sterilization of the vessel and medium. Fixed duration of 1 hour at typical conditions:
- Temperature: 121°C
- Pressure: 1.2 bar
3. Inoculation (1 hour)
Addition of the microorganism culture. Fixed duration of 1 hour including:
- Cooling to operating temperature
- Culture addition
- Initial mixing
4. Fermentation (Variable Duration)
Main bioprocess phase. Duration varies based on:
- Microorganism growth rate
- Substrate availability
- Operating conditions
- Target product concentration
5. Emptying (Variable Duration)
Harvesting of the fermentation broth. Duration depends on:
- Final volume
- Pump rate
- Viscosity of the broth
6. Washing (1 hour)
Cleaning of the bioreactor. Fixed duration of 1 hour including:
- Initial rinse
- Detergent circulation
- Final rinse
Understanding the Charts
1. Biomass and Substrate Concentrations
Shows the growth of cells (biomass) and consumption of nutrients (substrate) over time:
- Biomass typically follows S-shaped curve
- Substrate decreases as it's consumed
- Final biomass concentration indicates process yield
2. Biomass and Substrate Mass
Total mass evolution in the reactor:
- Accounts for volume changes
- Important for yield calculations
- Shows total substrate utilization
3. Oxygen Concentrations
Displays dissolved oxygen levels:
- O₂ Liquid: Available oxygen for cells
- O₂ Gas: Oxygen in gas bubbles
- Critical for aerobic processes
4. OUR and OTR
Oxygen transfer dynamics:
- OUR shows oxygen consumption by cells
- OTR indicates oxygen supply capability
- Balance needed for optimal growth
5. Bioreactor Volume
Tracks volume changes during operation:
- Important for fed-batch operation
- Shows filling and emptying phases
- Affects mixing and mass transfer
6. Air Volume
Gas hold-up in the reactor:
- Affects mixing patterns
- Influences oxygen transfer
- Varies by reactor type
7. Specific Growth Rate
Shows instantaneous growth rate:
- Indicates metabolic activity
- Helps identify growth phases
- Used for process optimization
Summary Statistics
Process Times
Understanding the duration of each phase helps in:
- Process scheduling
- Resource allocation
- Cost estimation
- Optimization opportunities
Performance Metrics
Key indicators of process efficiency:
- Final Biomass Concentration: Product yield
- Maximum Growth Rate: Process kinetics
- Oxygen Transfer Efficiency: Equipment performance
- Substrate Utilization: Process economics